The problem
In mid-2022, a series of TikTok videos revealed that certain 2011 to 2021 Hyundai and Kia models could be started with a USB cable because they shipped without engine immobilizers. Thefts of these vehicles surged. Class-action settlements exceeded $200M. Hyundai and Kia rolled out a free anti-theft software update in August 2023.
I wanted to answer three questions a senior product analyst at an automaker would care about:
- Did the viral disclosure cause a measurable shift in NHTSA complaint patterns, or was theft already trending up?
- Did the free software fix actually reduce complaints, and how quickly?
- What can automakers learn from complaint data as an early warning signal for security and safety issues?
The data
I pulled 54,009 complaints from the NHTSA VOQ API across two groups:
- Treatment: 2011 to 2021 Hyundai and Kia models known to lack immobilizers (Elantra, Sonata, Optima, Forte, Soul, and others). 25,281 complaints in the study window.
- Control: Toyota, Honda, and Nissan compact and midsize sedans and small SUVs from the same model years. Same demographic segment, but standard immobilizers throughout the period. 19,738 complaints in the study window.
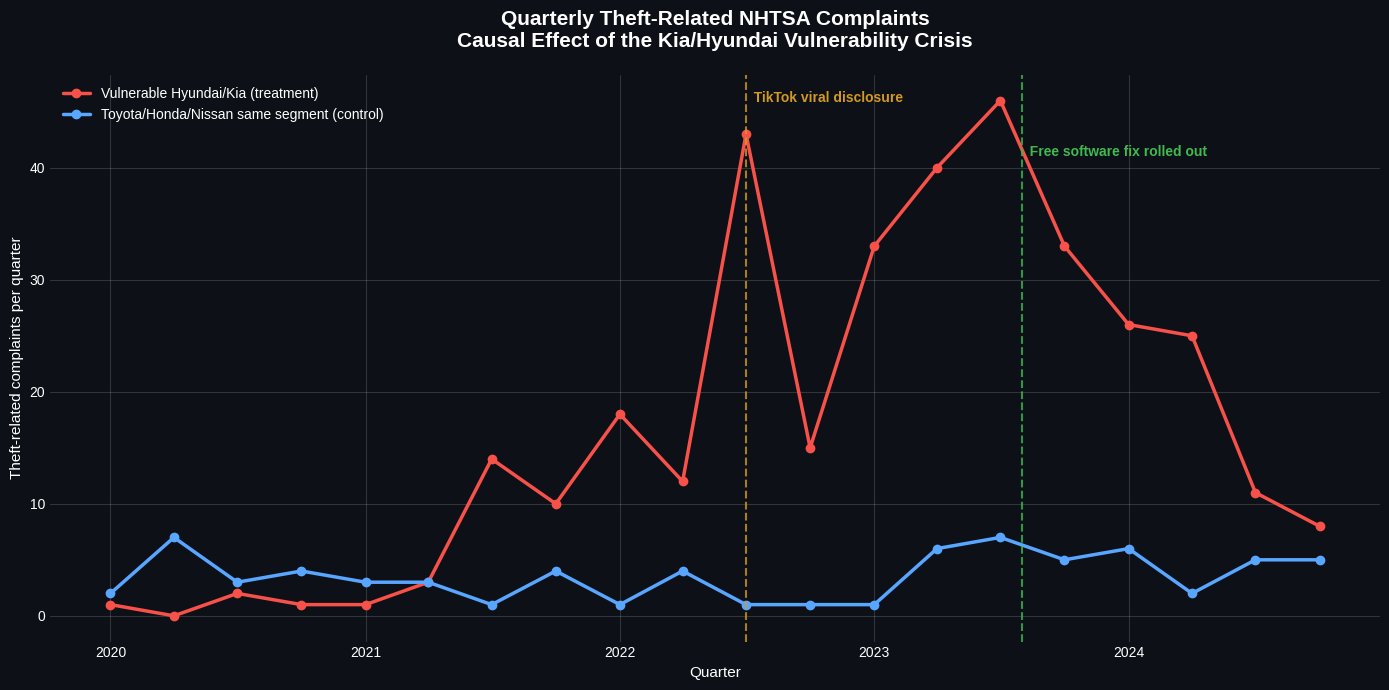
I isolated theft-related complaints using a keyword filter on the complaint summary and component fields (theft, stolen, immobilizer, USB cable, TikTok, and related terms). This gave a clean signal: 342 theft complaints in treatment, 71 in control. Raw complaint volumes are dominated by unrelated issues like steering and engine problems, so the keyword filter was essential.
The method
Difference-in-Differences. Compare the change in theft complaints in the treatment group before and after the viral disclosure to the change in the control group over the same period. The interaction term isolates the causal effect of the vulnerability disclosure on the treatment group.
Parallel trends test. DiD requires that treatment and control were trending at similar rates before the shock. I regressed pre-viral complaint counts on time, group, and their interaction. The interaction was significant (p<0.001), meaning parallel trends failed. Treatment was already climbing faster than control before TikTok.
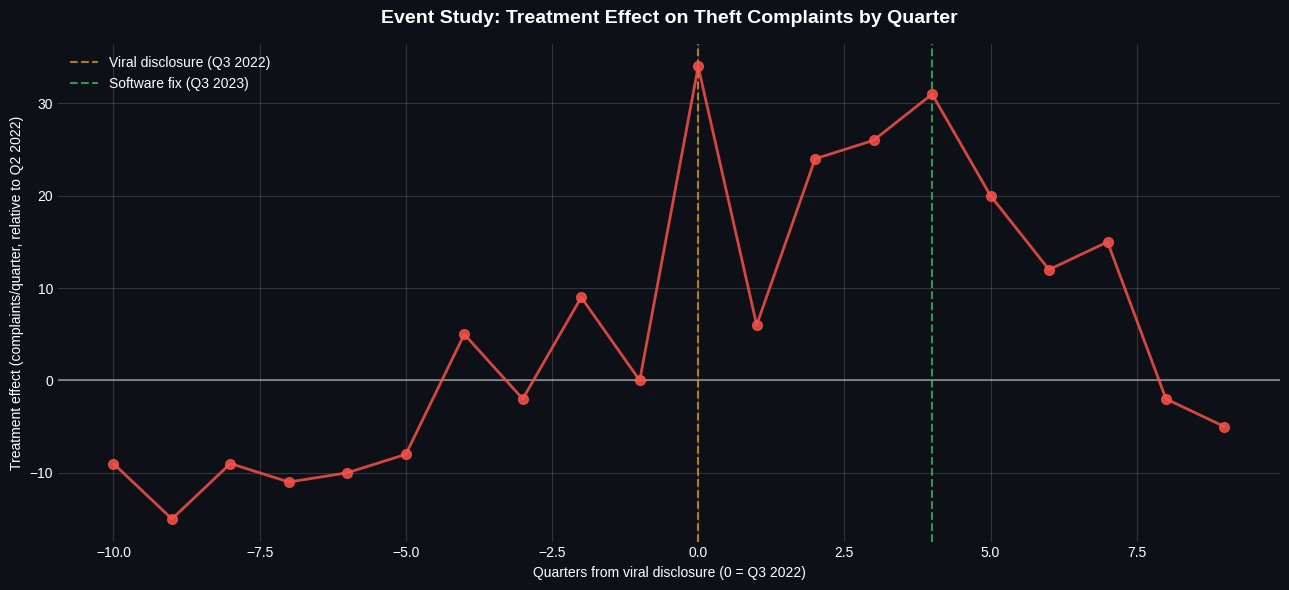
Event study. Because parallel trends failed, I ran an event study specification that estimates the treatment effect at each quarter relative to the viral disclosure. This is more honest than a single DiD estimate when pre-trends exist.
The findings
The viral disclosure caused a step-change in theft complaints. In the quarter TikTok went viral (Q3 2022), theft complaints in the treatment group jumped 34 above the reference quarter, while the control group barely moved. The effect stayed elevated at 24 to 31 complaints per quarter for the next full year, meaning the vulnerability drove sustained, not transient, harm.
The fix worked, but it took eight quarters to bring theft complaints back to baseline. That gap is the cost of designing an opt-in remedy.
The software fix worked, but slowly. Post-fix, effects declined from a peak of 31 (Q3 2023) to 20, 12, and eventually below zero by Q3 2024. It took roughly eight quarters (two years) for the treatment group's theft complaint rate to return to control-group levels. This gap reflects the incomplete adoption of an opt-in fix.
Formal DiD estimates confirm the story. The viral disclosure caused +7.0 additional theft complaints per month in treatment vs control (p<0.0001). The software fix reduced treatment complaints by 4.3 per month relative to control (p=0.042). Both effects are statistically significant. The DiD point estimates likely understate the true peak effect because they average across the full post-viral period.
Recommendation
For automaker product analytics teams:
- Treat consumer complaint data as a leading indicator. The complaint spike preceded the mainstream media narrative. Automated anomaly detection on complaint volume by model, geography, and component would surface issues weeks earlier than press coverage does.
- Design fixes for full adoption, not just release. An opt-in software update reaches a fraction of the affected fleet. The two-year decay from peak to baseline is the cost of that design choice. Push-based rollouts or dealership incentives would compress the recovery window.
- Instrument the causal read. Before a fix rolls out, define the control group and the counterfactual. Post-hoc DiD is possible, but pre-specified analyses are more defensible in regulatory and legal contexts.
Limitations
- The parallel trends assumption failed, so pure DiD estimates should be interpreted alongside the event study rather than in isolation.
- The keyword filter for theft complaints may miss some theft cases and include some false positives. Manual validation on a sample would tighten the estimate.
- The control group is Toyota, Honda, and Nissan, chosen for segment similarity. A synthetic control matched on model-year-level features would be a stronger design.
- NHTSA complaints are self-reported and biased toward serious incidents. True theft counts (from FBI UCR or insurance claims data) would give a more complete picture.